
BI and Data Visualization
The most specific and advanced analytics can have a significant impact on the business decision-making process only through a compelling presentation. However, at the same time it must be immediately usable, targeted to the individual user needs of knowledge but flexible enough to allow further customization compared to the fundamental analysis directly proposed. Target Research is able to provide its customers with dashboards based on the most successful BI tools on the market.
Thanks to the deep knowledge in the use of the main BI platforms and Visual-Based Data Discovery & Analysis, Target Research is specialized in planning and designing dashboards for visualization and integrated navigation of company data for operational and strategic reporting, capable of giving immediate, clear and high added value information.
Nowadays, be provided with enterprise dashboards for integrated and immediate (real-time or near-real-time) data query allows to maximize the potential of your business intelligence infrastructure by avoiding the dispersion of investments and information at every organizational level.
Depending on the strategic and operational objectives, the reporting can be arranged for::
- Visualization and comparative analysis of current and past performance
- Daily monitoring of company operations
- The immediate comparison of the Key Performance Indicators (KPIs) with the pre-setted targets in order to proactively identificate the problems and to define actions and strategies
- The comparative analysis of costs and benefits, of actions, actual and expected results at each company level (marketing, operational, finance)
- The application and visualization of insights deriving from the application of advanced statistical analysis
The maximum benefits deriving from the adoption of an innovative and dynamic company report are:
- Integration of different data sources and non-dispersion of information
- Easy and immediate access, understanding and diffusion of information at every company level (time-saving)
- Simplification and speeding up of complex analysis (time and cost saving)
- Improvement and optimization of the decision-making process and strategic planning
- Diffusion of a goal-driven and performance-based corporate culture
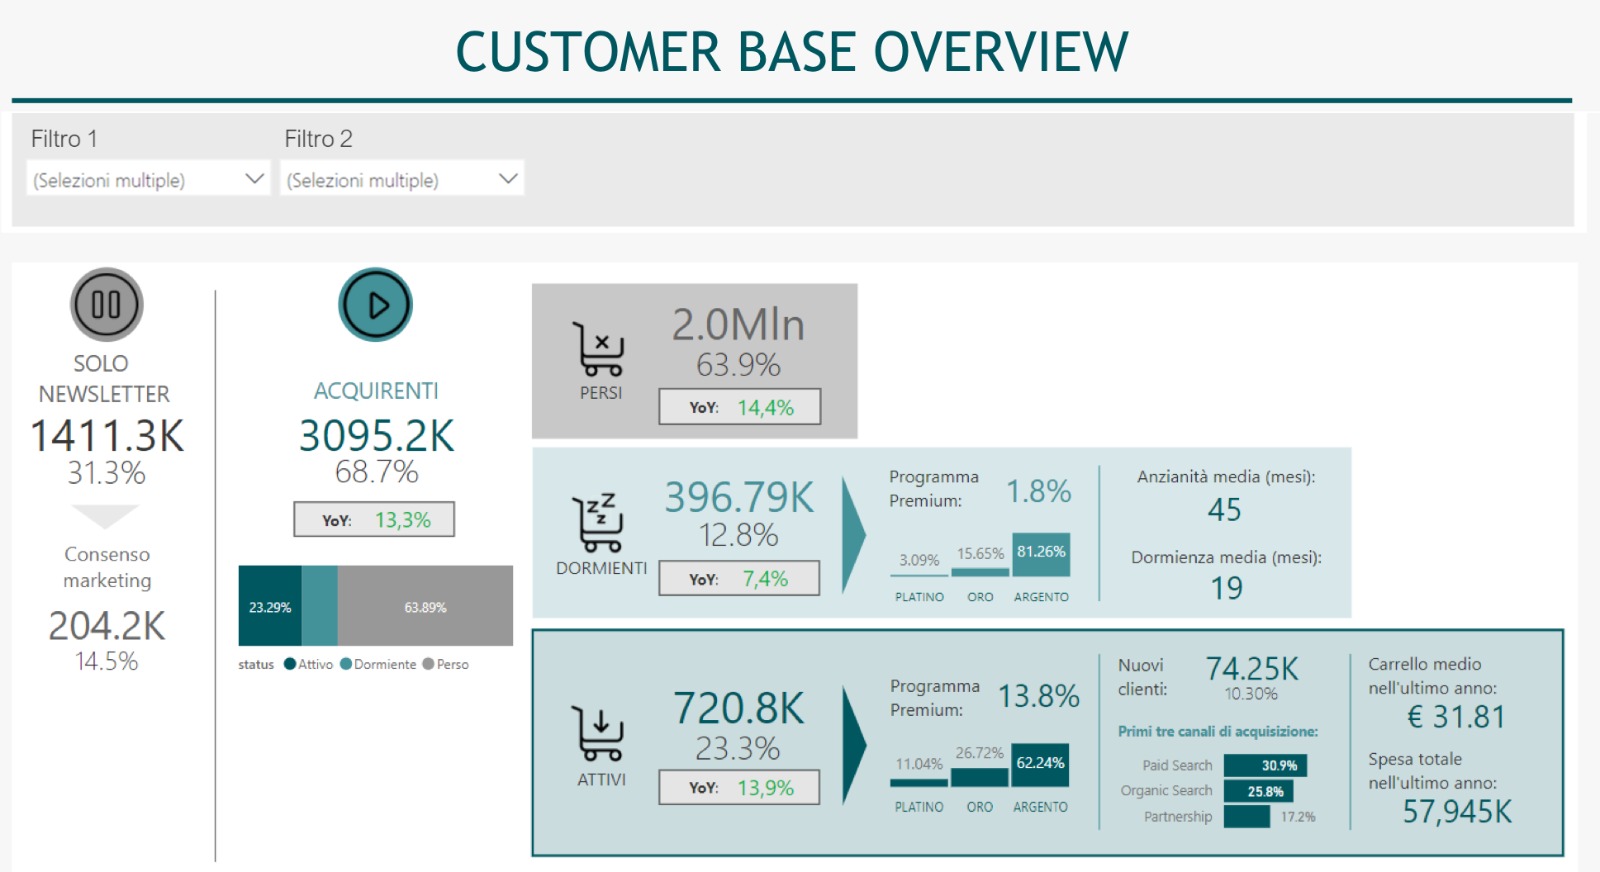
STRATEGIC DASHBOARDS
The main objective of creating strategic dashboards is to monitor and analyze the alignment of performance with the company strategic objectives.
This is a high-level reporting to show the main performance evaluation metrics compared to the relative pre-set company targets. The output is a complete summary of the company performance results in key time intervals for the organization (e.g. month, quarter, comparison with the previous period, etc.).
The design and structure of this type of dashboard meets the needs of company's board manager.
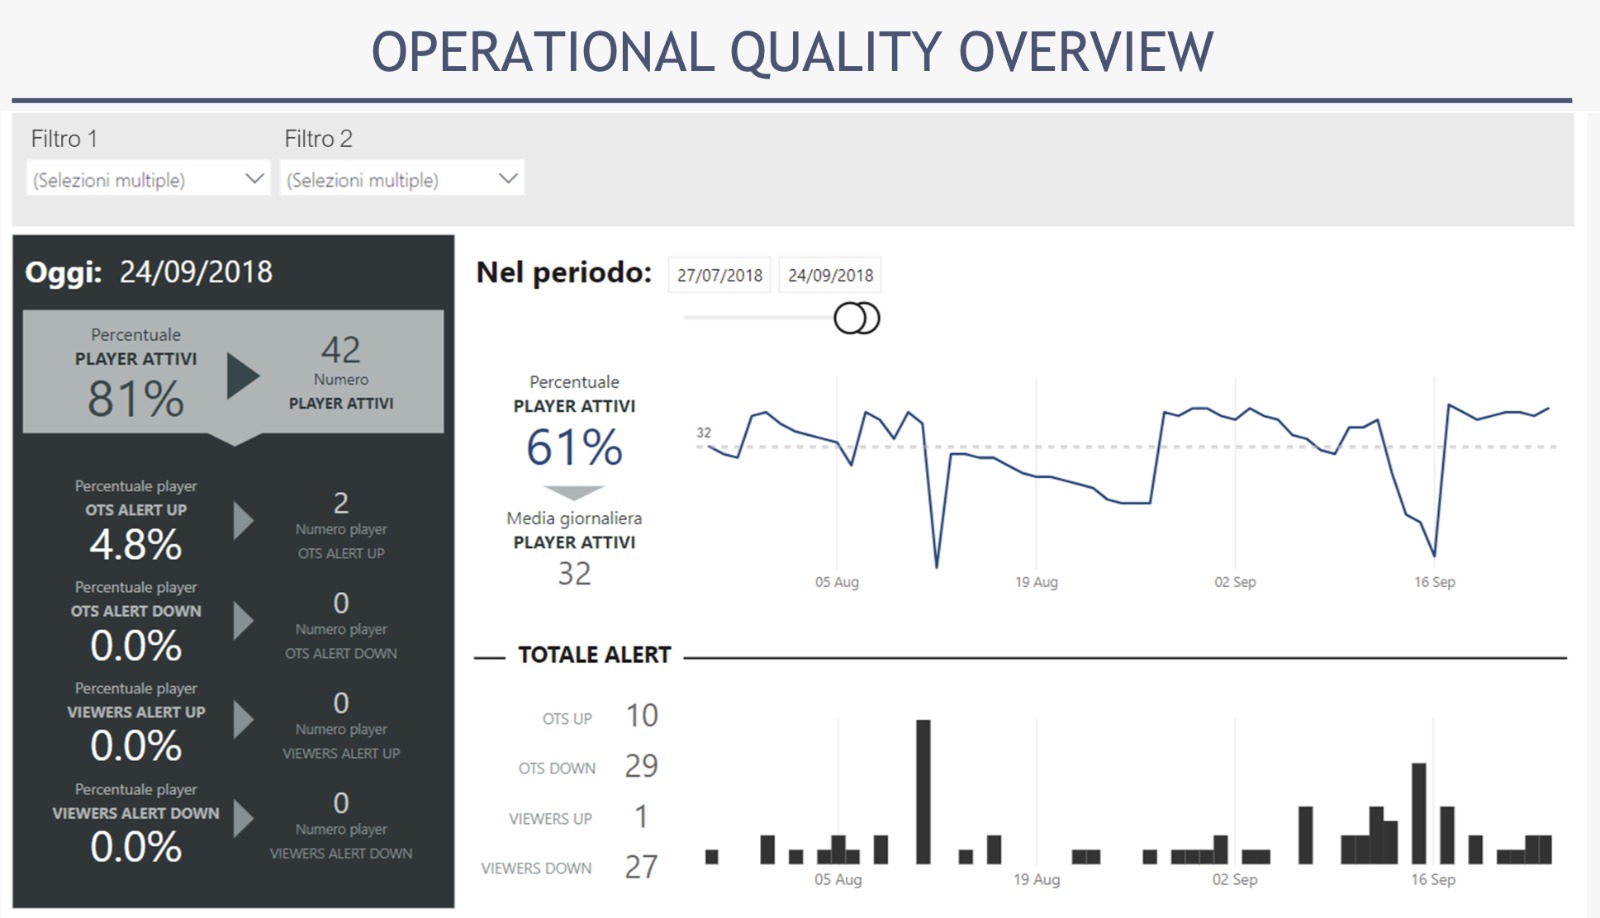
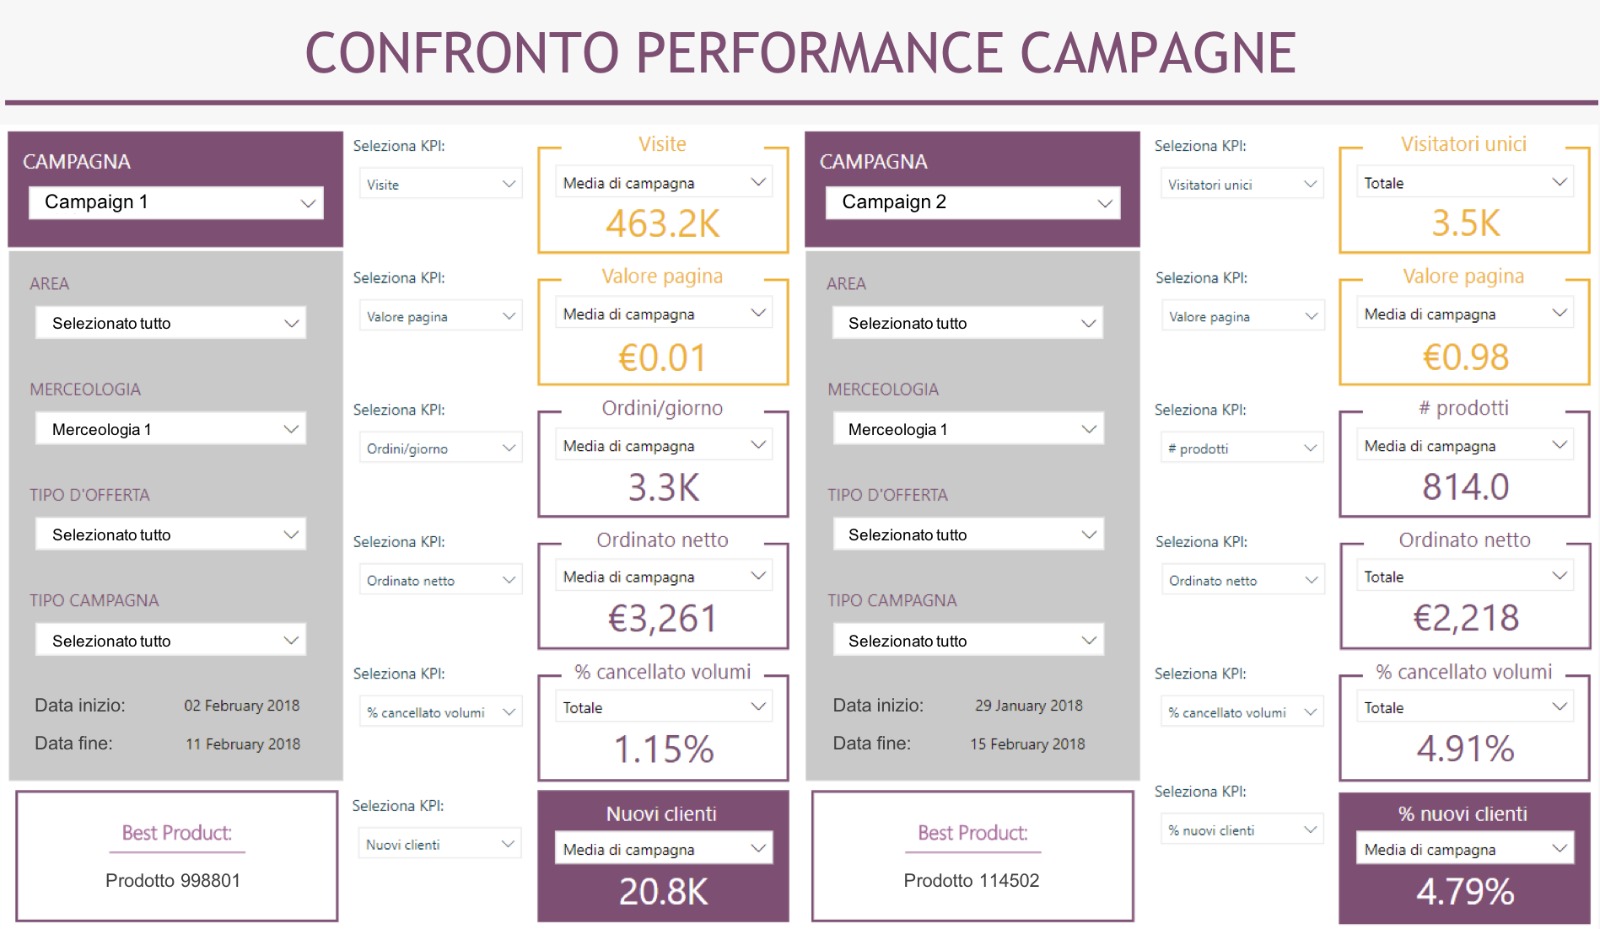
OPERATIONAL DASHBOARDS
The operational dashboards are designed to provide useful insights within the single business function, in order to monitor and analyze the actions taken day by day.
Built to be used by the task experts, they provide a greater detail on company's operations and allow to querying specific data in real-time (or almost, depending on the manifested needs), with a view that provides elements for a quick response granted by the preparation of data quality alerts.
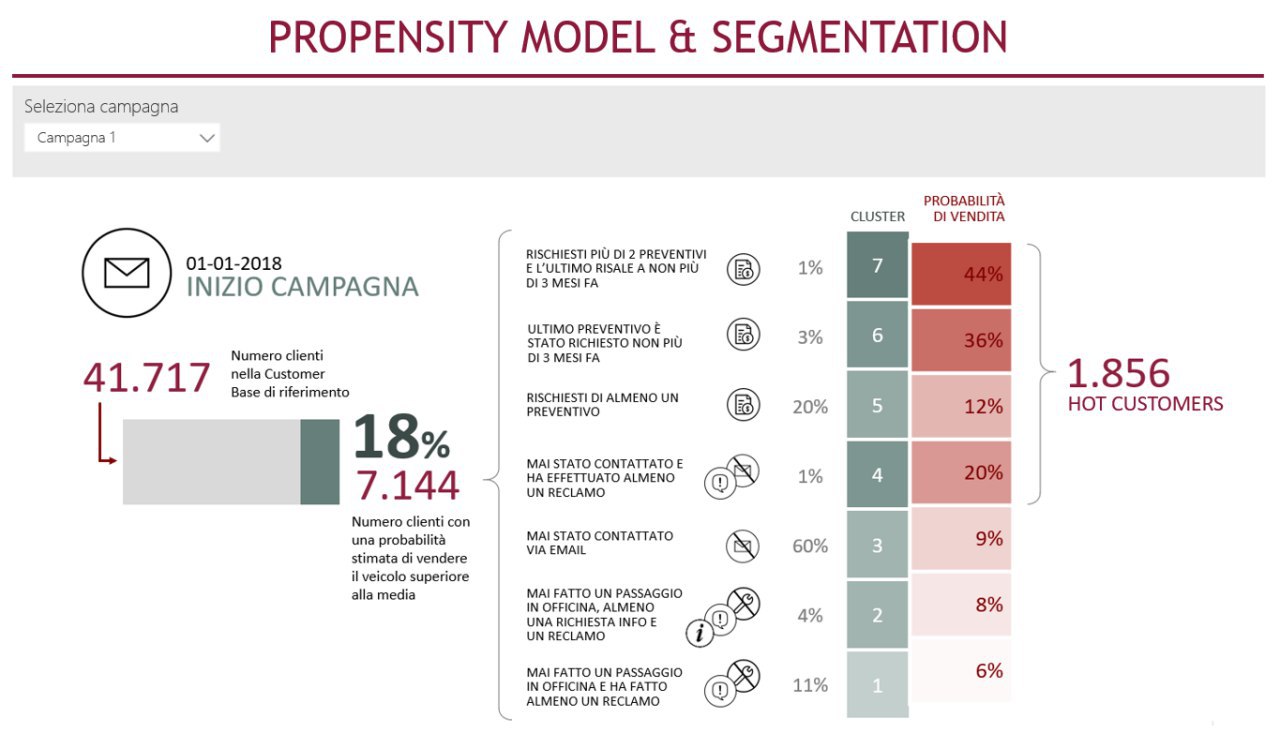
ANALYTICAL DASHBOARDS
The analytical dashboard aims to give a graphical and immediate vision to the outcome of advanced statistical analysis whose application allows to obtain new information with high added value for the business, such as: the identification of trends, the forecast of future results, the effects of the various actions on the main business outcomes and the migration of customer clusters.
These are the most complex types of dashboards, designed to be used by business analysts and data scientists, and designed to be integrated as a final step in small & big data analytics projects.